
Why can Amazon conversion rate fall while product rates rise?
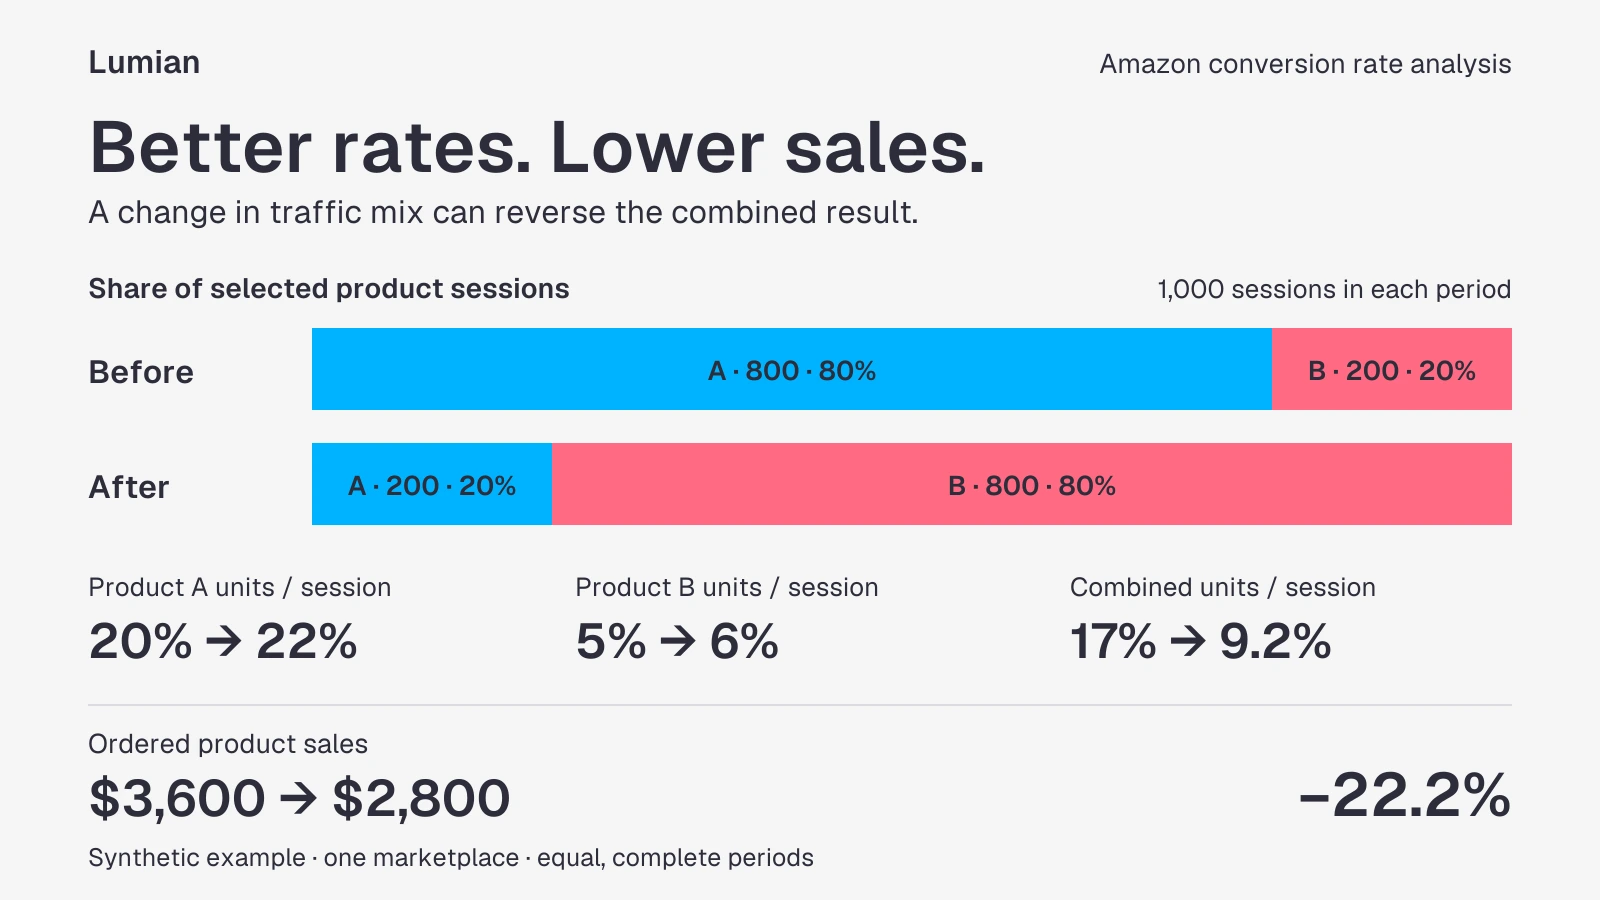
In the synthetic Amazon example below, sales fall 22.2% and the combined unit-session rate almost halves. Before asking an AI assistant to rewrite the listings, look at which products received the traffic.
An aggregate Amazon conversion rate can fall even when every product's unit-session rate improves. If more sessions go to products with lower unit-session rates, the changing traffic mix can pull down the combined rate. An AI analysis needs the product rows to locate that movement, then dated account evidence to investigate its cause.
The two products below share a marketplace and currency, compared over equally long, complete periods.
Product and period | Sessions | Units ordered | Units / session | Ordered product sales |
A, before | 800 | 160 | 20% | $3,200 |
A, after | 200 | 44 | 22% | $880 |
B, before | 200 | 10 | 5% | $400 |
B, after | 800 | 48 | 6% | $1,920 |
A improves from 20% to 22%. B improves from 5% to 6%. Selling prices stay at $20 and $40 per unit, respectively. Together, the products still record 1,000 sessions.
Yet their combined units per session falls from 17% to 9.2%, and sales drop from $3,600 to $2,800: a 22.2% decline.
The traffic distribution has reversed. A previously received 80% of recorded sessions; now it receives 20%. B gets the larger share, but still generates fewer units and fewer sales dollars per session. Better results within each product cannot make up for that shift.
This changes the next question. What happened to A's 600 missing sessions?
What does Amazon Unit Session Percentage measure?
Unit Session Percentage = units ordered ÷ sessions × 100, for the same product scope and period. It measures units relative to sessions, rather than the percentage of visitors who placed an order: a session can produce multiple units. Amazon's schema distinguishes units, order items, and orders. Amazon Sales and Traffic report schema
For our two products, the combined calculation is 170 / 1,000 before and 92 / 1,000 after. Sum the units and sessions, then divide. A simple average of the earlier rates gives (20% + 5%) / 2 = 12.5%, instead of 17%. It discards the very thing we need to investigate: their different traffic shares.
These session totals come from the selected child-ASIN rows. They are not unique shoppers across the account, and they need not equal a separately reported account-level denominator. Nor do the rows tell us that the same shoppers switched from A to B.
Calculate the traffic-mix contribution to lost sales
So how much of the $800 drop comes from the traffic mix? You can put a number on it before any AI gets involved.
Keep each product's old unit-session rate and old price, and swap in only the new session count:
(200 × 0.20 × $20) + (800 × 0.05 × $40) = $2,400
That is $1,200 below the original $3,600. Now apply the improved product rates: A adds $80, B adds $320, and sales reach the observed $2,800.
Calculation step | Calculated sales | Change at this step |
Start with the before period | $3,600 | — |
Update total sessions | $3,600 | $0 |
Update each product's share of sessions | $2,400 | −$1,200 |
Update each product's units per session | $2,800 | +$400 |
Update selling price per unit | $2,800 | $0 |
Traffic mix contributes −$1,200; improved product rates contribute +$400. Under this calculation order, those movements explain the $800 difference. A blanket diagnosis of “worse-converting listings” would get the direction of both product rates wrong.
Lumian Agents helps Amazon sellers and operators investigate account changes like this one using their account context. Start Free
Reproduce the revenue bridge in Python
Under the hood it's one line of algebra with four factors: total sessions, each product's share of them, its units per session and its average price. To split the $800, start from the before numbers and move one factor at a time to its after value, in this order: total sessions → traffic mix → units per session → selling price.
R   = ordered product sales across the selected rows
T   = sum of sessions across the selected child-ASIN rows
w_i = product i sessions / T
u_i = product i units / product i sessions
p_i = product i ordered sales / product i units

R = T × sum(w_i × u_i × p_i)
Here's that in Python. We used exact fractions, so the two ends land on the real sales totals with no rounding, and the asserts check that they do.
from fractions import Fraction as F

before = {"A": (800, 160, 3200), "B": (200, 10, 400)}
after = {"A": (200, 44, 880), "B": (800, 48, 1920)}

def factors(rows):
    total = sum(row[0] for row in rows.values())
    weights = {k: F(s, total) for k, (s, u, r) in rows.items()}
    rates = {k: F(u, s) for k, (s, u, r) in rows.items()}
    prices = {k: F(r, u) for k, (s, u, r) in rows.items()}
    return total, weights, rates, prices

def revenue(total, weights, rates, prices):
    return total * sum(weights[k] * rates[k] * prices[k]
                       for k in weights)

assert before.keys() == after.keys()
t0, w0, u0, p0 = factors(before)
t1, w1, u1, p1 = factors(after)
levels = [
    revenue(t0, w0, u0, p0),
    revenue(t1, w0, u0, p0),
    revenue(t1, w1, u0, p0),
    revenue(t1, w1, u1, p0),
    revenue(t1, w1, u1, p1),
]
effects = [b - a for a, b in zip(levels, levels[1:])]
assert levels[0] == sum(row[2] for row in before.values())
assert levels[-1] == sum(row[2] for row in after.values())
assert sum(effects) == levels[-1] - levels[0]
print(dict(zip(("traffic", "mix", "unit_rate", "price"), effects)))
Run it and you get traffic: 0, mix: -1200, unit_rate: 400, price: 0 (printed as fractions), which is the table above. With real account data, clean the inputs first (the next section covers how) and keep money in a decimal-safe type before it reaches factors.
A word on the order. When several factors move at once they interact, so a different order would split the same $800 differently between them. The total stays put. Pick an order, show it, and keep it the same each time you run the bridge. Also be clear about what the bridge can't do. It shows where the money went. Why it went there is a separate question: an ad change, a suppressed listing, or something else entirely.
Prepare Amazon Business Reports for AI analysis
Our numbers above were clean because we made them up. Exports from a real account usually aren't. A product row that's missing from one period makes its traffic look like it fell off a cliff, and a week you pulled on a Thursday makes demand look weaker than it is. The AI can only catch those if you tell it where each file came from.
Preserve the report's product scope and dates
When you request GET_SALES_AND_TRAFFIC_REPORT, you choose how to group dates (DAY, WEEK or MONTH) and how to group products (PARENT, CHILD or SKU). We want child ASINs, and you have to say so, because you get parent rows if you don't. Watch the dates too. Ask for a week or a month and the window can widen to the full calendar period, so the dates that come back aren't always the ones you asked for. Amazon SP-API analytics reports
There's a second trap, and it's easy to miss. The response has two arrays. salesAndTrafficByDate covers the whole account, one row per date. salesAndTrafficByAsin is per product, covering the whole report period. Join the two on every date and ASIN and you end up with daily product numbers Amazon never gave you. So leave each ASIN row attached to its report window. Need daily history per ASIN? Request daily reports for that. Amazon report schema
Hang on to the original export, too. Each row you pass along should still say where it came from (report ID, retrieval time, account, marketplace, currency, child ASIN and period dates) next to its sessions, units ordered and ordered product sales. Then look for duplicates. Account, marketplace, currency, ASIN and period together should point to exactly one row. If two rows share them, fix that before you calculate anything.
Compare like with like. Both periods should be finished, the same length and made of the same weekdays. Put promotions and availability events, such as a stockout, on the timeline next to the numbers. A promo week against a normal week is telling you something different from two ordinary weeks side by side.
Use ordered product sales from start to finish. Work out the average selling price from those same rows, sales divided by units, and ignore whatever the listing says today. Shipped revenue and profit are useful too, but they measure other things; our Amazon seller metrics guide explains where each one fits.
One more requirement. Every product in the bridge needs sessions and units above zero in both periods. New products, products you've dropped, missing rows and periods with zero units go on a separate line, outside the bridge. You'll be tempted to fill an undefined price with zero so the code runs. It will run, and it'll explain the change wrongly.
Give the AI an investigation to complete
Once the rows reconcile, there's real work for the AI. Ask it to tie the biggest movement to evidence and tell you what to check next. Give it the validated rows, the computed bridge, the source references and any dated account events. Here's a prompt you could start from. It hasn't been tested as a Lumian run, and Lumian doesn't need its input in this shape.
This is one account and marketplace, in one currency, over two periods. Stick to that. Before you analyse anything, check for missing products, duplicate rows, unfinished periods and rates that can't be worked out, and tell me about any you find.

I've already computed the revenue bridge, so use mine and say which order it applies the factors in. Take the biggest negative piece and tell me what changed, with ASINs, before and after values and report IDs. Then give me your best guess at why. Keep it apart from what the rows show, and tell me what dated evidence would back it up, what would count against it, what I should check next and who should check it. If the evidence isn't there, say so.

A drop in overall conversion doesn't mean bids or the listing changed, so don't assume either. Anything you'd change in the account goes through our usual approval first.
So what should a good answer say about A? Something like this: A's share of recorded product sessions dropped from 80% to 20%, even though its units per session went up from 20% to 22%. With the order we chose, mix accounts for −$1,200 across A and B. The thing to chase is where A's traffic went.
Now take two explanations the AI might offer. “A's listing stopped converting” is wrong, and the rows prove it, since A's rate went up. “A's bids were cut” could be right, but nothing here shows it yet. You'd need dated advertising records. If an answer blurs those two, you might act on it and never find out whether it was true.
One test worth running before you use this on a real account: delete A's before row and ask again. You want the assistant to complain about the missing row, not to explain A's sudden "collapse". A duplicated row or a half-finished week makes a good second test.
Investigate A's missing traffic with Lumian Agents
If the account sells on Amazon.com (US), you can run this investigation in Lumian Agents, our self-service product. Data Freshness is a good first stop: it helps you check dataset coverage and whether the agents are ready. Daily Sales Update looks at the reported movement, and Revenue Driver Breakdown examines selling price, traffic, conversion and mix. Before you follow a recommendation, make sure it's looking at the right account and period, and that the figures behind it hold up.
The Python bridge above gives you an independent way to check the arithmetic. It does not describe Lumian's internal algorithm.
Check whether shoppers could find and buy A
If A lost the Buy Box or its listing became suppressed around the traffic decline, investigate that event before commissioning new creative. Buy Box Tracker and Suppressed Listing Analysis are relevant jobs for those checks. If stock is stranded without an active listing, use Stranded Inventory Scanner to examine that issue.
Check the dates, though. If the suppression began after A's sessions had already dropped, it can't have caused the drop. If A's offer and listing records look healthy for the whole period, both explanations get weaker and you should look somewhere else. And don't lean on today's status. A listing that looks fine now could still have had a problem earlier in the window.
Look for the traffic source that changed
Next stop is A's advertising history and its search data. Suppose you think an ad change did it. You'd expect to find a campaign or budget change with a date on it, and A's ad delivery shifting around then. Check that the change really touched A, since two things happening in the same week doesn't make one the cause of the other. And a warning about ad clicks: Business Reports doesn't count sessions the same way, so subtracting clicks from sessions won't leave you with organic traffic.
To go down to individual search queries, SQP Opportunity Report looks for openings in your Search Query Performance data. Pulling that report through Amazon's API needs Brand Registry and the Brand Analytics role. Compare A's query visibility and purchase signals with their own history. Product sessions won't work as a yardstick here, because the search funnel counts from a different base. Then put those signals next to your sales and advertising reports, since Brand Analytics viewed alone can mislead. Amazon Search Query Performance documentation
Attribution needs its own check. Before you set ad sales against ordered product sales, look at the report's attribution window and which purchased products it counts. Amazon's seller guidance gives Sponsored Products a seven-day attribution window, so a click from a few days ago can still be credited with a sale today. Amazon advertising reporting guidance
Treat whatever the agents come back with as a recommendation, and review any change to the account before it happens. When the evidence does support acting, write down the ASIN, who owns it and the result you'll check afterwards. Look at margin and stock before you pay for more traffic. Where you can, change one thing at a time. If bids, images and price all move in the same week, you won't know which one made the difference.
Both products improved their units per session. The combined number still fell. The useful AI answer is the one that preserves those facts and follows A's missing 600 sessions far enough to justify the next decision.
Start free with Lumian Agents and investigate one recent sales change, beginning with the product rows behind it.