
Managed services
Your Amazon business,
fully managed.
A Brand Manager, specialists, and AI agents coordinate your agreed Amazon work.
Book a Strategy CallSee why Amazon conversion rate can fall even when every ASIN improves. Check the traffic mix with a worked Python example and investigate with Lumian Agents.
See why Amazon conversion rate can fall even when every ASIN improves. Check the traffic mix with a worked Python example and investigate with Lumian Agents.
See why Amazon conversion rate can fall even when every ASIN improves. Check the traffic mix with a worked Python example and investigate with Lumian Agents.
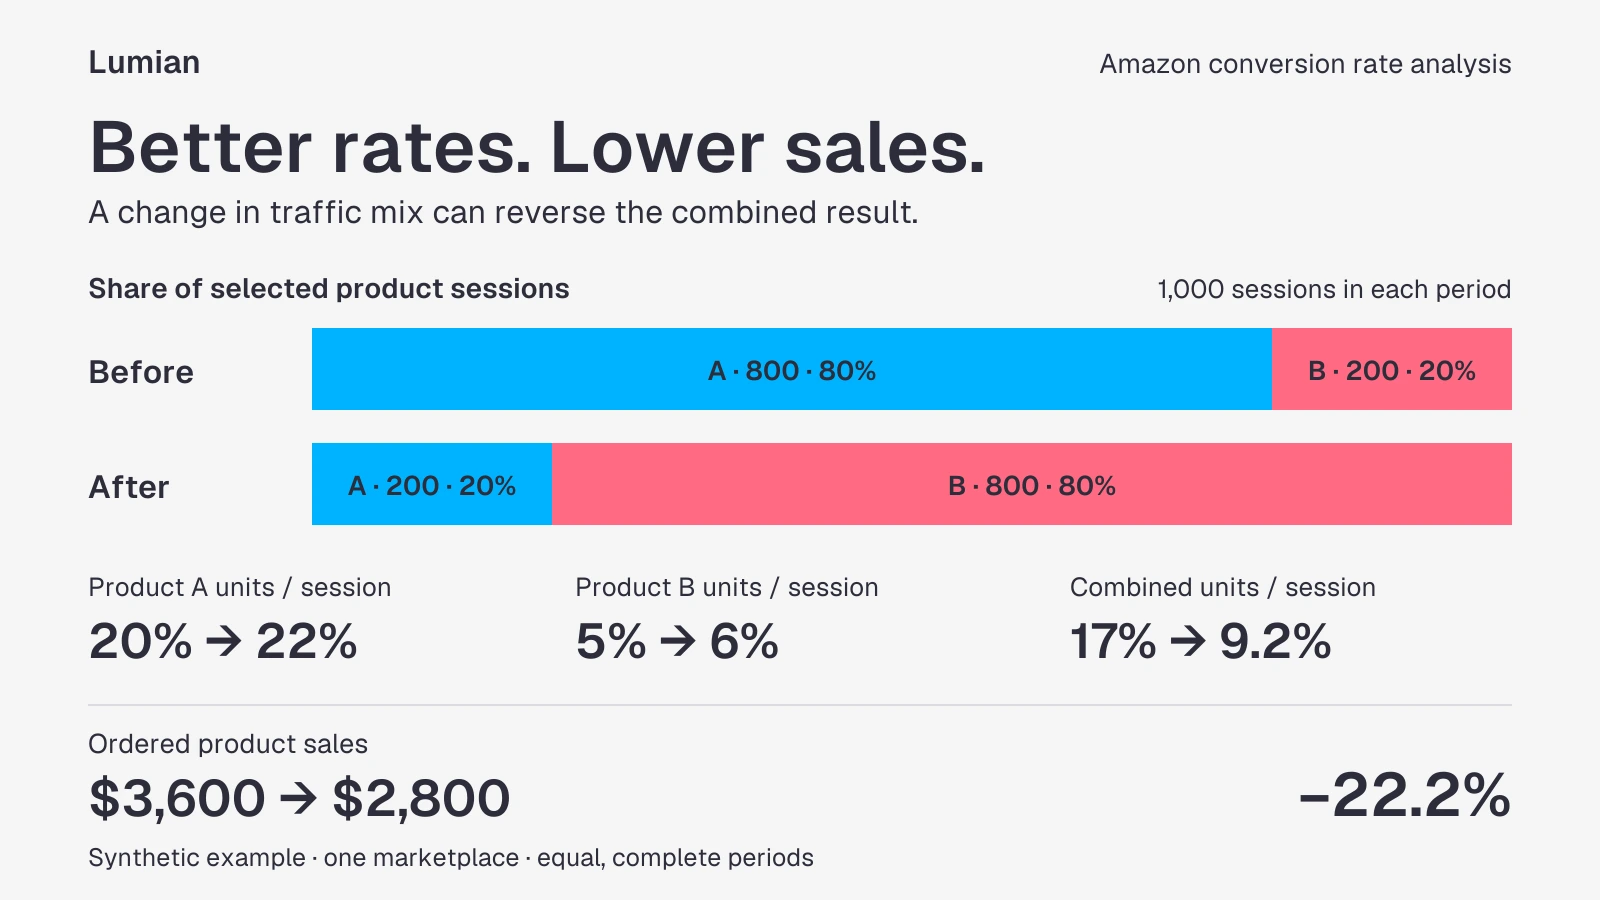
In the synthetic Amazon example below, sales fall 22.2% and the combined unit-session rate almost halves. Before asking an AI assistant to rewrite the listings, look at which products received the traffic.
An aggregate Amazon conversion rate can fall even when every product's unit-session rate improves. If more sessions go to products with lower unit-session rates, the changing traffic mix can pull down the combined rate. An AI analysis needs the product rows to locate that movement, then dated account evidence to investigate its cause.
The two products below share a marketplace and currency, compared over equally long, complete periods.
Product and period | Sessions | Units ordered | Units / session | Ordered product sales |
A, before | 800 | 160 | 20% | $3,200 |
A, after | 200 | 44 | 22% | $880 |
B, before | 200 | 10 | 5% | $400 |
B, after | 800 | 48 | 6% | $1,920 |
A improves from 20% to 22%. B improves from 5% to 6%. Selling prices stay at $20 and $40 per unit, respectively. Together, the products still record 1,000 sessions.
Yet their combined units per session falls from 17% to 9.2%, and sales drop from $3,600 to $2,800: a 22.2% decline.
The traffic distribution has reversed. A previously received 80% of recorded sessions; now it receives 20%. B gets the larger share, but still generates fewer units and fewer sales dollars per session. Better results within each product cannot make up for that shift.
This changes the next question. What happened to A's 600 missing sessions?
Unit Session Percentage = units ordered ÷ sessions × 100, for the same product scope and period. It measures units relative to sessions, rather than the percentage of visitors who placed an order: a session can produce multiple units. Amazon's schema distinguishes units, order items, and orders. Amazon Sales and Traffic report schema
For our two products, the combined calculation is 170 / 1,000 before and 92 / 1,000 after. Sum the units and sessions, then divide. A simple average of the earlier rates gives (20% + 5%) / 2 = 12.5%, instead of 17%. It discards the very thing we need to investigate: their different traffic shares.
These session totals come from the selected child-ASIN rows. They are not unique shoppers across the account, and they need not equal a separately reported account-level denominator. Nor do the rows tell us that the same shoppers switched from A to B.
How much of the $800 decline belongs to traffic mix? A revenue bridge can quantify that movement before the AI starts explaining it.
Hold each product's earlier unit-session rate and selling price constant, but give it the later session count:
(200 × 0.20 × $20) + (800 × 0.05 × $40) = $2,400
That is $1,200 below the original $3,600. Now apply the improved product rates: A adds $80, B adds $320, and sales reach the observed $2,800.
Calculation step | Calculated sales | Change at this step |
Start with the before period | $3,600 | — |
Update total sessions | $3,600 | $0 |
Update each product's share of sessions | $2,400 | −$1,200 |
Update each product's units per session | $2,800 | +$400 |
Update selling price per unit | $2,800 | $0 |
Traffic mix contributes −$1,200; improved product rates contribute +$400. Under this calculation order, those movements explain the $800 difference. A blanket diagnosis of “worse-converting listings” would get the direction of both product rates wrong.
The calculation uses four factors: total sessions, each product's traffic share, its units per session, and its average selling price.
R   = ordered product sales across the selected rows
T   = sum of sessions across the selected child-ASIN rows
w_i = product i sessions / T
u_i = product i units / product i sessions
p_i = product i ordered sales / product i units

R = T × sum(w_i × u_i × p_i)
Start with the before-period values. Substitute the after-period factors in the order total sessions → traffic mix → units per session → selling price. The following code uses exact fractions and checks both endpoints against the original sales totals.
from fractions import Fraction as F

before = {"A": (800, 160, 3200), "B": (200, 10, 400)}
after = {"A": (200, 44, 880), "B": (800, 48, 1920)}

def factors(rows):
    total = sum(row[0] for row in rows.values())
    weights = {k: F(s, total) for k, (s, u, r) in rows.items()}
    rates = {k: F(u, s) for k, (s, u, r) in rows.items()}
    prices = {k: F(r, u) for k, (s, u, r) in rows.items()}
    return total, weights, rates, prices

def revenue(total, weights, rates, prices):
    return total * sum(weights[k] * rates[k] * prices[k]
                       for k in weights)

assert before.keys() == after.keys()
t0, w0, u0, p0 = factors(before)
t1, w1, u1, p1 = factors(after)
levels = [
    revenue(t0, w0, u0, p0),
    revenue(t1, w0, u0, p0),
    revenue(t1, w1, u0, p0),
    revenue(t1, w1, u1, p0),
    revenue(t1, w1, u1, p1),
]
effects = [b - a for a, b in zip(levels, levels[1:])]
assert levels[0] == sum(row[2] for row in before.values())
assert levels[-1] == sum(row[2] for row in after.values())
assert sum(effects) == levels[-1] - levels[0]
print(dict(zip(("traffic", "mix", "unit_rate", "price"), effects)))
The output is traffic: 0, mix: -1200, unit_rate: 400, price: 0, expressed as fractions. For account data, validate the inputs described below and use decimal-safe monetary values before calling factors.
Factor order matters when several things change. Their interactions can produce different allocations under another order, even though the total revenue change stays the same. Keep the order visible and consistent. The bridge locates the movement; it cannot tell you whether an ad change, a suppressed listing, or something else caused it.
Before running this on an account, make sure the comparison means what it appears to mean. A missing product row could look like a traffic collapse. An unfinished week could look like falling demand. The AI needs enough source context to catch those mistakes.
Amazon's GET_SALES_AND_TRAFFIC_REPORT supports DAY, WEEK, and MONTH date granularity and PARENT, CHILD, and SKU ASIN granularity. Select CHILD explicitly here; the default is PARENT. Weekly and monthly requests can expand to full calendar periods, so inspect the dates returned. Amazon SP-API analytics reports
There is a less obvious trap in the response. salesAndTrafficByDate contains account data by date, while salesAndTrafficByAsin contains product data over the report period. Joining every date to every ASIN manufactures daily product detail that those arrays do not supply. Keep each ASIN row attached to its report window; obtain appropriately scoped daily reports if you need daily ASIN history. Amazon report schema
Retain the original export and carry its report ID, retrieval time, account, marketplace, currency, child ASIN, and period dates alongside sessions, units ordered, and ordered product sales. Make the combination of account, marketplace, currency, ASIN, and period unique; reject duplicate rows before calculating.
Use complete periods of equal duration and weekday composition. Keep promotions and availability events beside the timeline. A promotion week versus an ordinary week is a different comparison from two otherwise similar weeks.
Stay with ordered product sales throughout. Derive average selling price as sales divided by units from those same rows, rather than using today's listing price. Shipped revenue and profit answer different questions; the Amazon seller metrics guide puts those measures in context.
This bridge requires positive sessions and units for every included product in both periods. Separate new products, removed products, missing rows, and zero-unit periods; report their contribution outside this comparable-product bridge. Filling an undefined price with zero makes the code run at the cost of changing the explanation.
Once the rows reconcile, the AI has a useful job: connect a specific movement to relevant evidence and identify what to check next. Supply the validated rows, computed bridge, source references, and dated account events. This suggested prompt describes the task; it is not a tested Lumian run or a required product input format.
Analyze the supplied account, marketplace, currency, and periods only.
Flag missing products, duplicate rows, incomplete periods, and undefined rates.
Use the computed revenue bridge and state its factor order.
For the largest negative contribution, return:
- The observed change, with ASINs, before/after values, and source report IDs.
- A hypothesis, distinguished from what the rows actually establish.
- The dated evidence needed to assess that hypothesis.
- A finding that would weaken it.
- The next check and the person responsible.
If the evidence is missing, say what is missing.
Do not infer a bid or listing change from aggregate conversion alone.
Keep any proposed account change subject to the applicable approval.
For A, a defensible answer begins: its share of recorded product sessions fell from 80% to 20%, while its units per session rose from 20% to 22%. Under the chosen order, mix accounts for −$1,200 across A and B. The next investigation concerns A's lost traffic.
“A's listing stopped converting” fails immediately against the rows. “A's bids were cut” remains a hypothesis until dated advertising evidence supports it. A fluent answer that skips this distinction is easy to act on and hard to learn from.
Test the workflow's restraint as well as its arithmetic: remove a product row, duplicate one, or supply an unfinished period. The assistant should identify the defect. A polished explanation of broken inputs is a failed analysis.
For an Amazon.com (US) account, Data Freshness in the self-service Lumian Agents product helps inspect dataset coverage and agent readiness. Daily Sales Update reviews the reported movement; Revenue Driver Breakdown examines selling price, traffic, conversion, and mix. Check the account, period, and supporting figures before following a recommendation.
The Python bridge above gives you an independent way to check the arithmetic. It does not describe Lumian's internal algorithm.
If A lost the Buy Box or its listing became suppressed around the traffic decline, investigate that event before commissioning new creative. Buy Box Tracker and Suppressed Listing Analysis are relevant jobs for those checks. If stock is stranded without an active listing, use Stranded Inventory Scanner to examine that issue.
Timing matters. A suppression that started after the session decline cannot explain the earlier loss. Healthy offer and listing records throughout the affected period would weaken those explanations and move the investigation elsewhere. A current healthy status alone would not rule out a problem earlier in the window.
Next, inspect A's advertising history and search evidence. If you suspect an advertising change, look for a dated campaign event and a corresponding change in delivery for A. Trace the campaign or budget change to that product; a timestamp alone doesn't connect the event to its lost sessions. Ad clicks also aren't interchangeable with Business Reports sessions, so don't subtract them and call the remainder organic traffic.
For query-level investigation, SQP Opportunity Report helps identify opportunities in Search Query Performance. Amazon requires Brand Registry and the Brand Analytics role for its API report. Compare query visibility and purchase signals against their own baselines; that funnel has a different denominator from product sessions. Amazon Search Query Performance documentation
Keep advertising attribution separate too. Check the actual report's window and purchased-product scope before comparing ad sales with ordered product sales. Amazon's seller guidance describes a seven-day Sponsored Products attribution window, so recent clicks can still produce later attributed purchases. Amazon advertising reporting guidance
Treat these outputs as recommendations, then review any proposed account change. Once the evidence supports an action, record the affected ASIN, its owner, and the outcome to check. Consider margin and stock before buying more traffic; changing bids, imagery, and price together will make the result harder to interpret.
Both products improved their units per session. The combined number still fell. The useful AI answer is the one that preserves those facts and follows A's missing 600 sessions far enough to justify the next decision.
Start free with Lumian Agents and investigate one recent sales change, beginning with the product rows behind it.
Tejesh Vaish is VP of Engineering at Lumian, working on AI-powered applications and full-stack development.
In the synthetic Amazon example below, sales fall 22.2% and the combined unit-session rate almost halves. Before asking an AI assistant to rewrite the listings, look at which products received the traffic.
An aggregate Amazon conversion rate can fall even when every product's unit-session rate improves. If more sessions go to products with lower unit-session rates, the changing traffic mix can pull down the combined rate. An AI analysis needs the product rows to locate that movement, then dated account evidence to investigate its cause.
The two products below share a marketplace and currency, compared over equally long, complete periods.
Product and period | Sessions | Units ordered | Units / session | Ordered product sales |
A, before | 800 | 160 | 20% | $3,200 |
A, after | 200 | 44 | 22% | $880 |
B, before | 200 | 10 | 5% | $400 |
B, after | 800 | 48 | 6% | $1,920 |
A improves from 20% to 22%. B improves from 5% to 6%. Selling prices stay at $20 and $40 per unit, respectively. Together, the products still record 1,000 sessions.
Yet their combined units per session falls from 17% to 9.2%, and sales drop from $3,600 to $2,800: a 22.2% decline.
The traffic distribution has reversed. A previously received 80% of recorded sessions; now it receives 20%. B gets the larger share, but still generates fewer units and fewer sales dollars per session. Better results within each product cannot make up for that shift.
This changes the next question. What happened to A's 600 missing sessions?
Unit Session Percentage = units ordered ÷ sessions × 100, for the same product scope and period. It measures units relative to sessions, rather than the percentage of visitors who placed an order: a session can produce multiple units. Amazon's schema distinguishes units, order items, and orders. Amazon Sales and Traffic report schema
For our two products, the combined calculation is 170 / 1,000 before and 92 / 1,000 after. Sum the units and sessions, then divide. A simple average of the earlier rates gives (20% + 5%) / 2 = 12.5%, instead of 17%. It discards the very thing we need to investigate: their different traffic shares.
These session totals come from the selected child-ASIN rows. They are not unique shoppers across the account, and they need not equal a separately reported account-level denominator. Nor do the rows tell us that the same shoppers switched from A to B.
How much of the $800 decline belongs to traffic mix? A revenue bridge can quantify that movement before the AI starts explaining it.
Hold each product's earlier unit-session rate and selling price constant, but give it the later session count:
(200 × 0.20 × $20) + (800 × 0.05 × $40) = $2,400
That is $1,200 below the original $3,600. Now apply the improved product rates: A adds $80, B adds $320, and sales reach the observed $2,800.
Calculation step | Calculated sales | Change at this step |
Start with the before period | $3,600 | — |
Update total sessions | $3,600 | $0 |
Update each product's share of sessions | $2,400 | −$1,200 |
Update each product's units per session | $2,800 | +$400 |
Update selling price per unit | $2,800 | $0 |
Traffic mix contributes −$1,200; improved product rates contribute +$400. Under this calculation order, those movements explain the $800 difference. A blanket diagnosis of “worse-converting listings” would get the direction of both product rates wrong.
The calculation uses four factors: total sessions, each product's traffic share, its units per session, and its average selling price.
R   = ordered product sales across the selected rows
T   = sum of sessions across the selected child-ASIN rows
w_i = product i sessions / T
u_i = product i units / product i sessions
p_i = product i ordered sales / product i units

R = T × sum(w_i × u_i × p_i)
Start with the before-period values. Substitute the after-period factors in the order total sessions → traffic mix → units per session → selling price. The following code uses exact fractions and checks both endpoints against the original sales totals.
from fractions import Fraction as F

before = {"A": (800, 160, 3200), "B": (200, 10, 400)}
after = {"A": (200, 44, 880), "B": (800, 48, 1920)}

def factors(rows):
    total = sum(row[0] for row in rows.values())
    weights = {k: F(s, total) for k, (s, u, r) in rows.items()}
    rates = {k: F(u, s) for k, (s, u, r) in rows.items()}
    prices = {k: F(r, u) for k, (s, u, r) in rows.items()}
    return total, weights, rates, prices

def revenue(total, weights, rates, prices):
    return total * sum(weights[k] * rates[k] * prices[k]
                       for k in weights)

assert before.keys() == after.keys()
t0, w0, u0, p0 = factors(before)
t1, w1, u1, p1 = factors(after)
levels = [
    revenue(t0, w0, u0, p0),
    revenue(t1, w0, u0, p0),
    revenue(t1, w1, u0, p0),
    revenue(t1, w1, u1, p0),
    revenue(t1, w1, u1, p1),
]
effects = [b - a for a, b in zip(levels, levels[1:])]
assert levels[0] == sum(row[2] for row in before.values())
assert levels[-1] == sum(row[2] for row in after.values())
assert sum(effects) == levels[-1] - levels[0]
print(dict(zip(("traffic", "mix", "unit_rate", "price"), effects)))
The output is traffic: 0, mix: -1200, unit_rate: 400, price: 0, expressed as fractions. For account data, validate the inputs described below and use decimal-safe monetary values before calling factors.
Factor order matters when several things change. Their interactions can produce different allocations under another order, even though the total revenue change stays the same. Keep the order visible and consistent. The bridge locates the movement; it cannot tell you whether an ad change, a suppressed listing, or something else caused it.
Before running this on an account, make sure the comparison means what it appears to mean. A missing product row could look like a traffic collapse. An unfinished week could look like falling demand. The AI needs enough source context to catch those mistakes.
Amazon's GET_SALES_AND_TRAFFIC_REPORT supports DAY, WEEK, and MONTH date granularity and PARENT, CHILD, and SKU ASIN granularity. Select CHILD explicitly here; the default is PARENT. Weekly and monthly requests can expand to full calendar periods, so inspect the dates returned. Amazon SP-API analytics reports
There is a less obvious trap in the response. salesAndTrafficByDate contains account data by date, while salesAndTrafficByAsin contains product data over the report period. Joining every date to every ASIN manufactures daily product detail that those arrays do not supply. Keep each ASIN row attached to its report window; obtain appropriately scoped daily reports if you need daily ASIN history. Amazon report schema
Retain the original export and carry its report ID, retrieval time, account, marketplace, currency, child ASIN, and period dates alongside sessions, units ordered, and ordered product sales. Make the combination of account, marketplace, currency, ASIN, and period unique; reject duplicate rows before calculating.
Use complete periods of equal duration and weekday composition. Keep promotions and availability events beside the timeline. A promotion week versus an ordinary week is a different comparison from two otherwise similar weeks.
Stay with ordered product sales throughout. Derive average selling price as sales divided by units from those same rows, rather than using today's listing price. Shipped revenue and profit answer different questions; the Amazon seller metrics guide puts those measures in context.
This bridge requires positive sessions and units for every included product in both periods. Separate new products, removed products, missing rows, and zero-unit periods; report their contribution outside this comparable-product bridge. Filling an undefined price with zero makes the code run at the cost of changing the explanation.
Once the rows reconcile, the AI has a useful job: connect a specific movement to relevant evidence and identify what to check next. Supply the validated rows, computed bridge, source references, and dated account events. This suggested prompt describes the task; it is not a tested Lumian run or a required product input format.
Analyze the supplied account, marketplace, currency, and periods only.
Flag missing products, duplicate rows, incomplete periods, and undefined rates.
Use the computed revenue bridge and state its factor order.
For the largest negative contribution, return:
- The observed change, with ASINs, before/after values, and source report IDs.
- A hypothesis, distinguished from what the rows actually establish.
- The dated evidence needed to assess that hypothesis.
- A finding that would weaken it.
- The next check and the person responsible.
If the evidence is missing, say what is missing.
Do not infer a bid or listing change from aggregate conversion alone.
Keep any proposed account change subject to the applicable approval.
For A, a defensible answer begins: its share of recorded product sessions fell from 80% to 20%, while its units per session rose from 20% to 22%. Under the chosen order, mix accounts for −$1,200 across A and B. The next investigation concerns A's lost traffic.
“A's listing stopped converting” fails immediately against the rows. “A's bids were cut” remains a hypothesis until dated advertising evidence supports it. A fluent answer that skips this distinction is easy to act on and hard to learn from.
Test the workflow's restraint as well as its arithmetic: remove a product row, duplicate one, or supply an unfinished period. The assistant should identify the defect. A polished explanation of broken inputs is a failed analysis.
For an Amazon.com (US) account, Data Freshness in the self-service Lumian Agents product helps inspect dataset coverage and agent readiness. Daily Sales Update reviews the reported movement; Revenue Driver Breakdown examines selling price, traffic, conversion, and mix. Check the account, period, and supporting figures before following a recommendation.
The Python bridge above gives you an independent way to check the arithmetic. It does not describe Lumian's internal algorithm.
If A lost the Buy Box or its listing became suppressed around the traffic decline, investigate that event before commissioning new creative. Buy Box Tracker and Suppressed Listing Analysis are relevant jobs for those checks. If stock is stranded without an active listing, use Stranded Inventory Scanner to examine that issue.
Timing matters. A suppression that started after the session decline cannot explain the earlier loss. Healthy offer and listing records throughout the affected period would weaken those explanations and move the investigation elsewhere. A current healthy status alone would not rule out a problem earlier in the window.
Next, inspect A's advertising history and search evidence. If you suspect an advertising change, look for a dated campaign event and a corresponding change in delivery for A. Trace the campaign or budget change to that product; a timestamp alone doesn't connect the event to its lost sessions. Ad clicks also aren't interchangeable with Business Reports sessions, so don't subtract them and call the remainder organic traffic.
For query-level investigation, SQP Opportunity Report helps identify opportunities in Search Query Performance. Amazon requires Brand Registry and the Brand Analytics role for its API report. Compare query visibility and purchase signals against their own baselines; that funnel has a different denominator from product sessions. Amazon Search Query Performance documentation
Keep advertising attribution separate too. Check the actual report's window and purchased-product scope before comparing ad sales with ordered product sales. Amazon's seller guidance describes a seven-day Sponsored Products attribution window, so recent clicks can still produce later attributed purchases. Amazon advertising reporting guidance
Treat these outputs as recommendations, then review any proposed account change. Once the evidence supports an action, record the affected ASIN, its owner, and the outcome to check. Consider margin and stock before buying more traffic; changing bids, imagery, and price together will make the result harder to interpret.
Both products improved their units per session. The combined number still fell. The useful AI answer is the one that preserves those facts and follows A's missing 600 sessions far enough to justify the next decision.
Start free with Lumian Agents and investigate one recent sales change, beginning with the product rows behind it.
Tejesh Vaish is VP of Engineering at Lumian, working on AI-powered applications and full-stack development.