Amazon Seller Metrics for 2026: Measure the System, Not the Dashboard
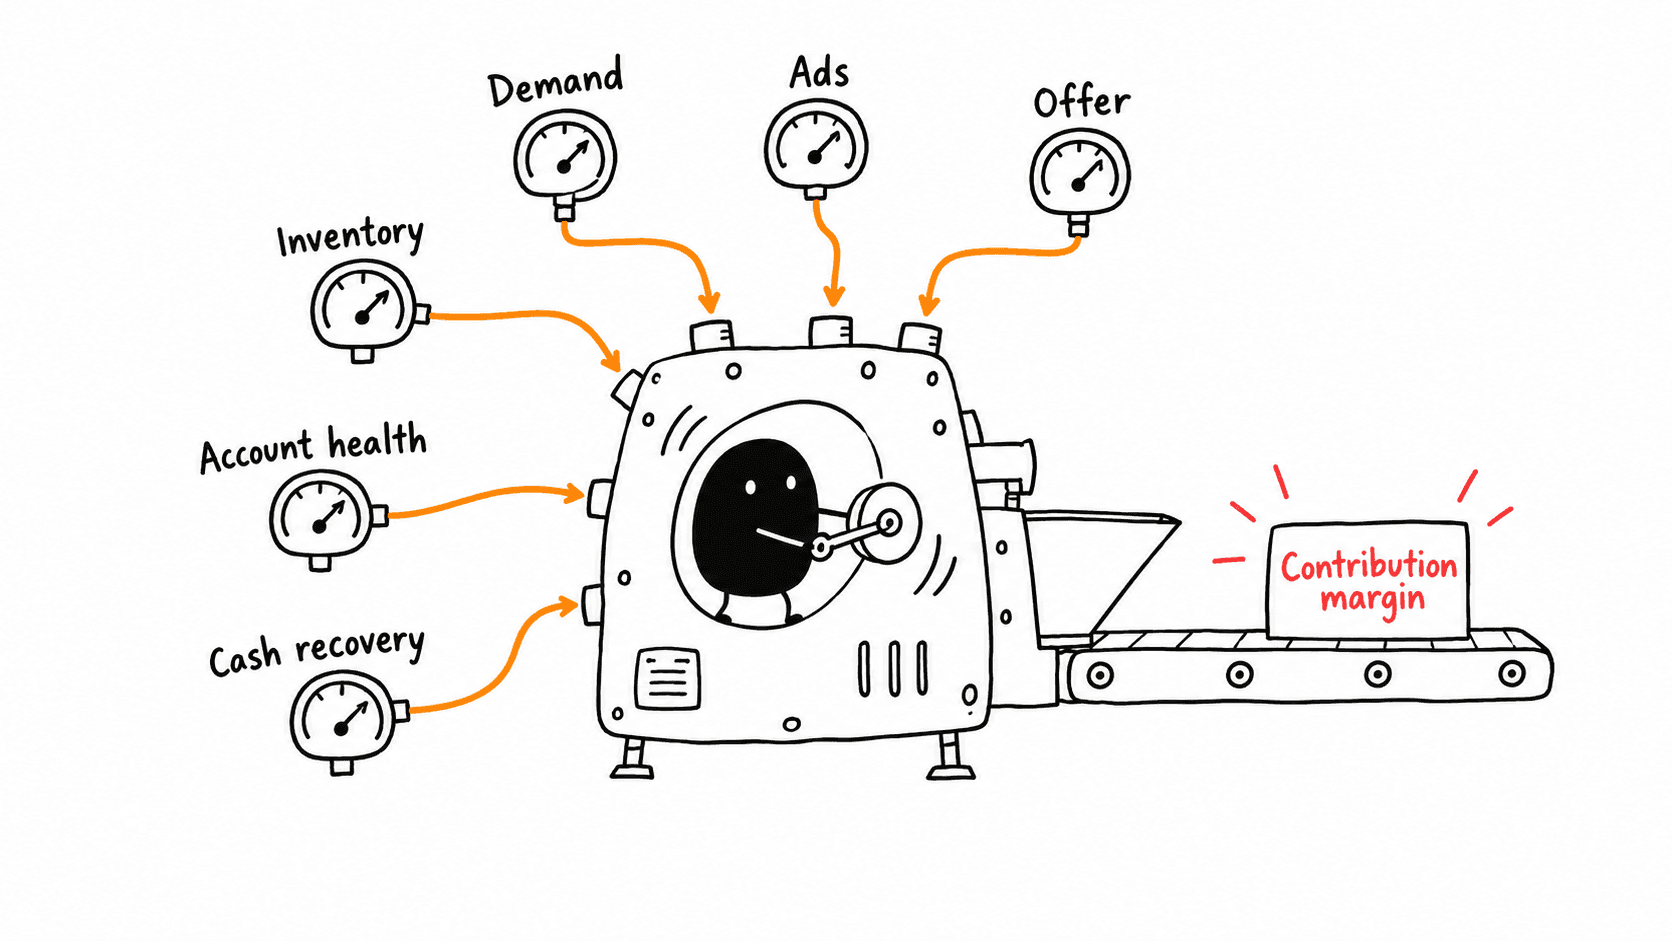
Build an Amazon scorecard around contribution margin, then use six connected metric groups to explain what moved.
Build the scorecard around profit
Amazon brands rarely suffer from a shortage of metrics. The harder problem is deciding which numbers deserve attention, how they influence one another, and who acts when the pattern changes. A useful measurement system connects customer demand, advertising, inventory, account health, and profit instead of reviewing each in isolation.
TL;DR
Start with contribution margin, then use conversion, advertising efficiency, Buy Box share, inventory cover, and account-health measures to explain what moved. Avoid universal benchmarks where the economics differ by product. Set targets from your own margin, growth stage, and operating constraints, and pair every metric with an owner and an action.
Key takeaways
Revenue can rise while cash generation deteriorates. Contribution margin belongs at the top of the scorecard.
ACoS measures advertising spend against attributed advertising sales. TACoS uses total sales and is useful for seeing advertising in the context of the whole business.
There is no universally good TACoS or ACoS. The acceptable level depends on gross margin, organic contribution, launch strategy, and repeat purchase behavior.
Account Health Rating and Order Defect Rate are risk controls, not growth metrics. Amazon states that AHR ranges from 0 to 1,000 and that ODR should remain below 1%.
Metrics become operational only when thresholds lead to a named investigation or action.
Ordered sales are visible and emotionally satisfying, which is why they often dominate weekly reporting. They do not show whether the business earned money after product cost, Amazon fees, advertising, promotions, refunds, storage, and freight.
A practical starting point is contribution margin:
Contribution margin = net sales minus product cost, Amazon fees, advertising, promotions, refunds, and variable fulfillment costs.
The exact definition should match the way your finance team runs the business. The important part is consistency. If inbound freight is included one month and excluded the next, the trend becomes noise.
Once margin is clear, the rest of the scorecard should explain why it changed. That keeps teams from optimizing a local metric while weakening the business as a whole.
The six metric groups that matter
1. Demand and conversion
Sessions show traffic. Unit Session Percentage shows how effectively product-detail-page traffic becomes ordered units. Review both by ASIN and over comparable periods. A conversion decline can come from price, Buy Box loss, suppressed content, review changes, traffic mix, delivery promise, or a competitor move.
Do not respond to a conversion drop with a listing rewrite by default. First identify whether the shopper saw the same offer, the same price, and the same delivery promise.
2. Advertising efficiency
Amazon defines ACoS as advertising spend divided by attributed advertising sales. It is useful for campaign and targeting decisions, but it does not show the organic sales generated alongside paid activity.
TACoS = advertising spend divided by total sales.
TACoS is not an official Amazon metric, but it gives operators a broader view of advertising intensity. Interpret it with margin and growth stage. A launch may accept higher advertising cost to build visibility. A mature ASIN with stable organic demand may be expected to produce a different mix.
Break-even ACoS can be estimated from the margin available before advertising. If a product keeps 28% of net sales after variable non-ad costs, an ACoS above 28% loses money on the attributed sale before any overhead. That is a decision boundary, not a performance target.
3. Buy Box and offer quality
Buy Box share is often the fastest explanation for an unexpected sales change. Review it with price, inventory position, fulfillment method, delivery promise, and seller competition. If sessions hold steady while conversion and units fall on the same day the Buy Box is lost, the operating response is different from a demand problem.
4. Inventory health
Weeks of cover, forecast accuracy, sell-through, stranded inventory, aged inventory, and inbound status should be read together. A stockout can erase organic momentum; excess stock can trap cash and accumulate storage costs.
Use a demand forecast that records its assumptions, then measure forecast error. A precise reorder recommendation built on an unmeasured forecast is false confidence.
5. Account health
Account Health Rating reflects policy-compliance risk and is shown as a score from 0 to 1,000. Order Defect Rate measures orders with one or more defects over a rolling period; Amazon’s target is below 1%. These measures require routine monitoring because the cost of missing a material issue can be much larger than a week of weaker advertising performance.
The score alone is not the operating question. Ask which event changed it, what the response deadline is, and who owns the evidence.
6. Cash recovery and leakage
Reimbursements, fee discrepancies, returns, chargebacks, and unexplained adjustments belong in the same operating review as growth metrics. Money lost after the sale can be invisible in a revenue-only dashboard.
Track the amount identified, amount submitted, amount recovered, aging by claim type, and the percentage of cases with complete evidence. That turns reimbursement work from an occasional audit into a controlled process.
Diagnose with cause-and-effect paths
Use cause-and-effect paths
A scorecard should make diagnosis faster. Consider a simple example:
Units fall 14% week over week. Sessions are almost flat. Conversion falls three percentage points. Buy Box share dropped on one major ASIN after a competitor price change.
That path points to offer competitiveness, not traffic acquisition. Raising advertising spend would bring more shoppers to an offer that is already converting worse. The first action is to investigate the Buy Box and price economics.
Now consider the opposite pattern: Buy Box and conversion are stable, but sessions and impressions decline across the category. That calls for search-demand, rank, advertising-delivery, and category analysis.
The numbers are similar at the top line. The actions are completely different.
Set targets from economics, not internet averages
External benchmarks can help frame a question, but they should not become automatic targets. A 20% ACoS can be healthy for a high-margin product and unacceptable for a low-margin one. A falling TACoS can signal stronger organic demand, or it can mean advertising was cut while total demand temporarily held.
For every target, document:
The business objective it supports.
The product or portfolio scope.
The time window and comparison period.
The economic boundary.
The action triggered when the target is missed.
Review targets after material changes in fees, price, cost of goods, conversion, or strategy.
Turn reporting into a weekly operating rhythm
A compact weekly review can run in this order:
Margin and cash: contribution margin, refunds, fees, and reimbursements.
Demand: sales, units, sessions, conversion, and price.
Advertising: spend, attributed sales, ACoS, TACoS, and budget delivery.
Availability: Buy Box, weeks of cover, inbound status, and aged inventory.
Risk: account health, suppressed listings, policy notifications, and unresolved cases.
Decisions: owner, action, deadline, and verification method.
Separate observation from decision. “Conversion fell” is an observation. “Audit Buy Box, delivery promise, and price history for the three affected ASINs by Tuesday” is an operating decision.
What automation should and should not do
Automation is valuable for collecting reports, normalizing definitions, detecting material changes, and preparing an investigation. It should show the source data and preserve an audit trail. Material account changes should follow explicit approval rules.
The best automated message is not “ACoS increased.” It is “ACoS increased because spend rose on two non-brand targets while attributed sales were flat; contribution margin on those ASINs is now below the agreed floor.” That is specific enough for an operator to make a decision.
Frequently Asked Questions
What is the most important Amazon seller metric?
Contribution margin is the most useful top-level measure because it connects sales to economic value. It still needs supporting metrics to explain what changed.
What is a good TACoS?
There is no universal number. Set a range from product margin, growth stage, organic sales mix, and the role advertising plays in the strategy. Recalculate it when price, fees, or product cost changes.
How often should metrics be reviewed?
Critical risks such as account health, Buy Box loss, suppression, and stockout exposure should be monitored daily. Portfolio and strategic decisions usually benefit from a consistent weekly and monthly review.
How can an AI agent help?
An agent can read reports on a schedule, connect changes across functions, and prepare evidence for action. It should identify the source, respect approval settings, and make it easy for a person to verify the conclusion.

Co-Founder & CEO, Lumian
Robin Lobo is Co-Founder and CEO of Lumian. He built and sold a seven-figure eyeglasses brand on Amazon and spent several years on the client side of traditional agencies before founding Lumian, an AI-native Amazon agency backed by $3M led by Bowery Capital.