What KPIs and Reporting Cadence Should You Expect from an Amazon Management Agency?
Learn which core KPIs, advertising metrics, and reporting cadences you should expect from an Amazon agency to ensure complete transparency and growth.
TL;DR
What to Expect:
A comprehensive guide detailing the essential Key Performance Indicators (KPIs), operational metrics, and reporting frequencies brands should demand when hiring an Amazon management agency.
Key Takeaways:
Core KPI Categories: A complete agency framework covers four distinct areas: advertising efficiency, sales velocity, catalog conversion health, and inventory availability.
The Reporting Shift: Static monthly PDF decks are obsolete. Enterprise brands need real-time metric streams paired with structured weekly operational updates and monthly strategic alignment sessions.
Data Integration: Key metrics like Advertising Cost of Sales (ACoS), Total Advertising Cost of Sales (TACoS), Unit Session Percentage (CVR), and stockout risk must be evaluated in context with one another, rather than isolated in separate spreadsheets.
Hybrid Advantage: Combining continuous AI metric monitoring with expert human governance ensures immediate anomaly detection while maintaining long-term strategic direction.
Intro
Partnering with an e-commerce agency to manage an Amazon store is a major commitment. Whether an enterprise brand is scaling an existing catalog or optimizing ad spend across international channels, holding an agency partner accountable requires absolute transparency around performance metrics and communication schedules.
Too many brand owners encounter an agency reporting trap: receiving dense, retrospective PDF slide decks at the end of every month that highlight vanity metrics while obscuring core profitability issues. Evaluating agency performance requires understanding which metrics matter, how often they should be reported, and how modern data platforms turn reporting from a static exercise into an active growth driver.
Why Key Performance Indicators and Reporting Frequency Define Agency Success
Measuring agency performance goes beyond checking whether gross sales grew month-over-month. E-commerce on Amazon involves dozens of interconnected variables. For instance, increasing ad budgets can drive short-term sales growth, but if Total Advertising Cost of Sales (TACoS) spikes while organic search ranks fall, that top-line revenue growth may actually erode net profit margins.
Setting clear expectations around Key Performance Indicators (KPIs) ensures that your agency aligns its daily activities with your business targets. Furthermore, the cadence of these reports dictates how quickly your business can react to market shifts, buy box suppressions, or unexpected competitor price drops.
Core Amazon KPIs Your Agency Must Measure
A professional e-commerce agency must report on metrics across four core operational pillars: advertising efficiency, brand sales velocity, catalog conversion health, and inventory stability.
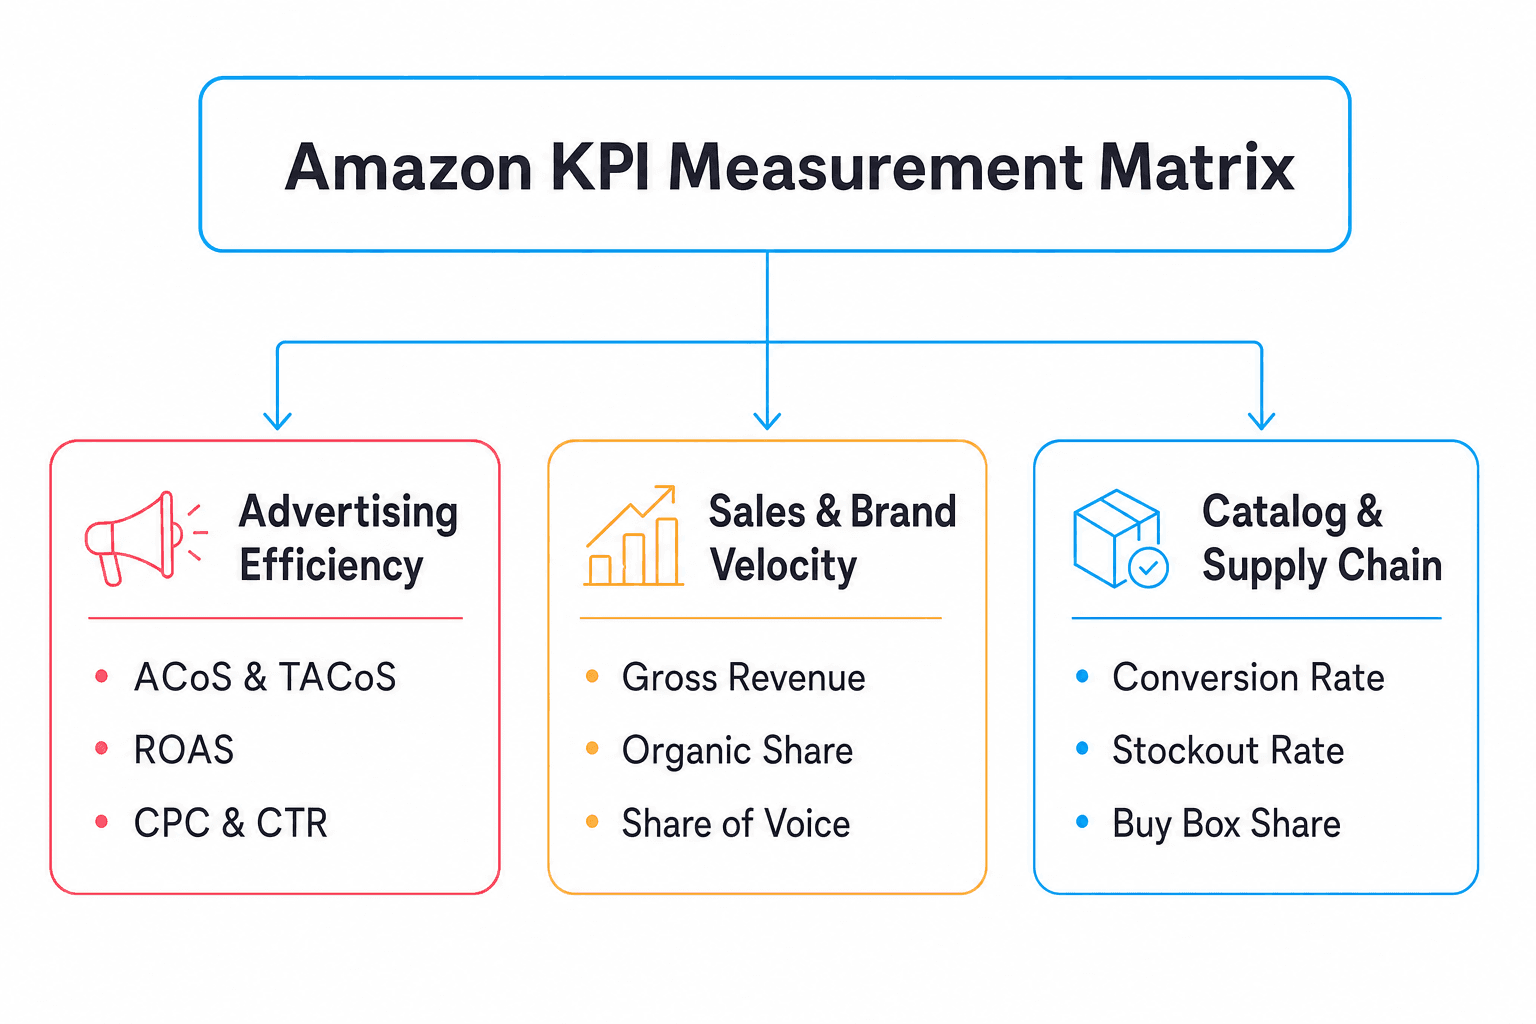
1. Advertising and Capital Efficiency Metrics
Pay-per-click (PPC) advertising drives search visibility on Amazon, but ad spend must be managed against strict margin targets.
Advertising Cost of Sales (ACoS): Measures direct ad efficiency by dividing total ad spend by ad-attributed sales. Industry benchmark data published by Sequence Commerce on Amazon advertising statistics indicates that the average ACoS across categories sits around 30.20%, though target levels vary based on product margins and launch stages.
Total Advertising Cost of Sales (TACoS): Measures total ad spend relative to total revenue (organic plus paid). TACoS reveals whether advertising is successfully building organic rank. A declining TACoS indicates that ad spend is generating sustainable organic momentum.
Return on Ad Spend (ROAS): The inverse of ACoS, calculated as ad revenue divided by ad spend.
Cost Per Click (CPC) and Click-Through Rate (CTR): Tracking CPC against CTR ensures ad campaigns capture high-intent shoppers without overpaying for competitive keywords.
2. Sales Volume and Organic Brand Velocity
Top-line growth must be analyzed alongside attribution channels to verify long-term brand health.
Gross Revenue vs. Net Revenue: Revenue tracking must account for platform fees, return allowances, and promotional discounts.
Organic vs. Paid Revenue Split: Healthy Amazon brands target an organic revenue share of 60% to 70%, ensuring the business does not rely entirely on paid advertising to sustain order volume.
Share of Voice (SoV) and Keyword Rank: Tracking organic search position across top-priority seed keywords verifies whether marketing efforts are capturing category market share.
3. Listing Conversion and Catalog Health
Traffic acquisition yields minimal return if product detail pages fail to convert incoming sessions into completed orders.
Unit Session Percentage (Conversion Rate - CVR): Calculated by dividing total orders by total product page sessions. Market research from Feedvisor cited by Amra & Elma on Amazon conversion benchmarks shows average Amazon conversion rates hovering around 12.3%, with top-performing categories reaching significantly higher CVRs.
Buy Box Percentage: Monitors the percentage of time your listings hold the Buy Box. Drops in Buy Box ownership signal pricing conflicts, hijacker activity, or inventory shortages.
Catalog Compliance & Suppression Status: Tracks detail page suppressions, title truncation policy flags, or missing main image assets that harm search indexing.
4. Supply Chain and Stock Availability Metrics
Advertising and listing optimizations depend on consistent product availability.
Stockout Days and In-Stock Rate: Running out of stock degrades organic keyword rankings and wastes accumulated ad equity.
Inventory Turn Rate & Days of Supply: Integrates sales velocity with supplier lead times to optimize safety stock levels, preventing capital tie-up in dead inventory.
Establishing the Ideal Reporting Cadence
Receiving data at the right time is just as important as measuring the right metrics. A static monthly report is insufficient for managing high-velocity marketplace channels.
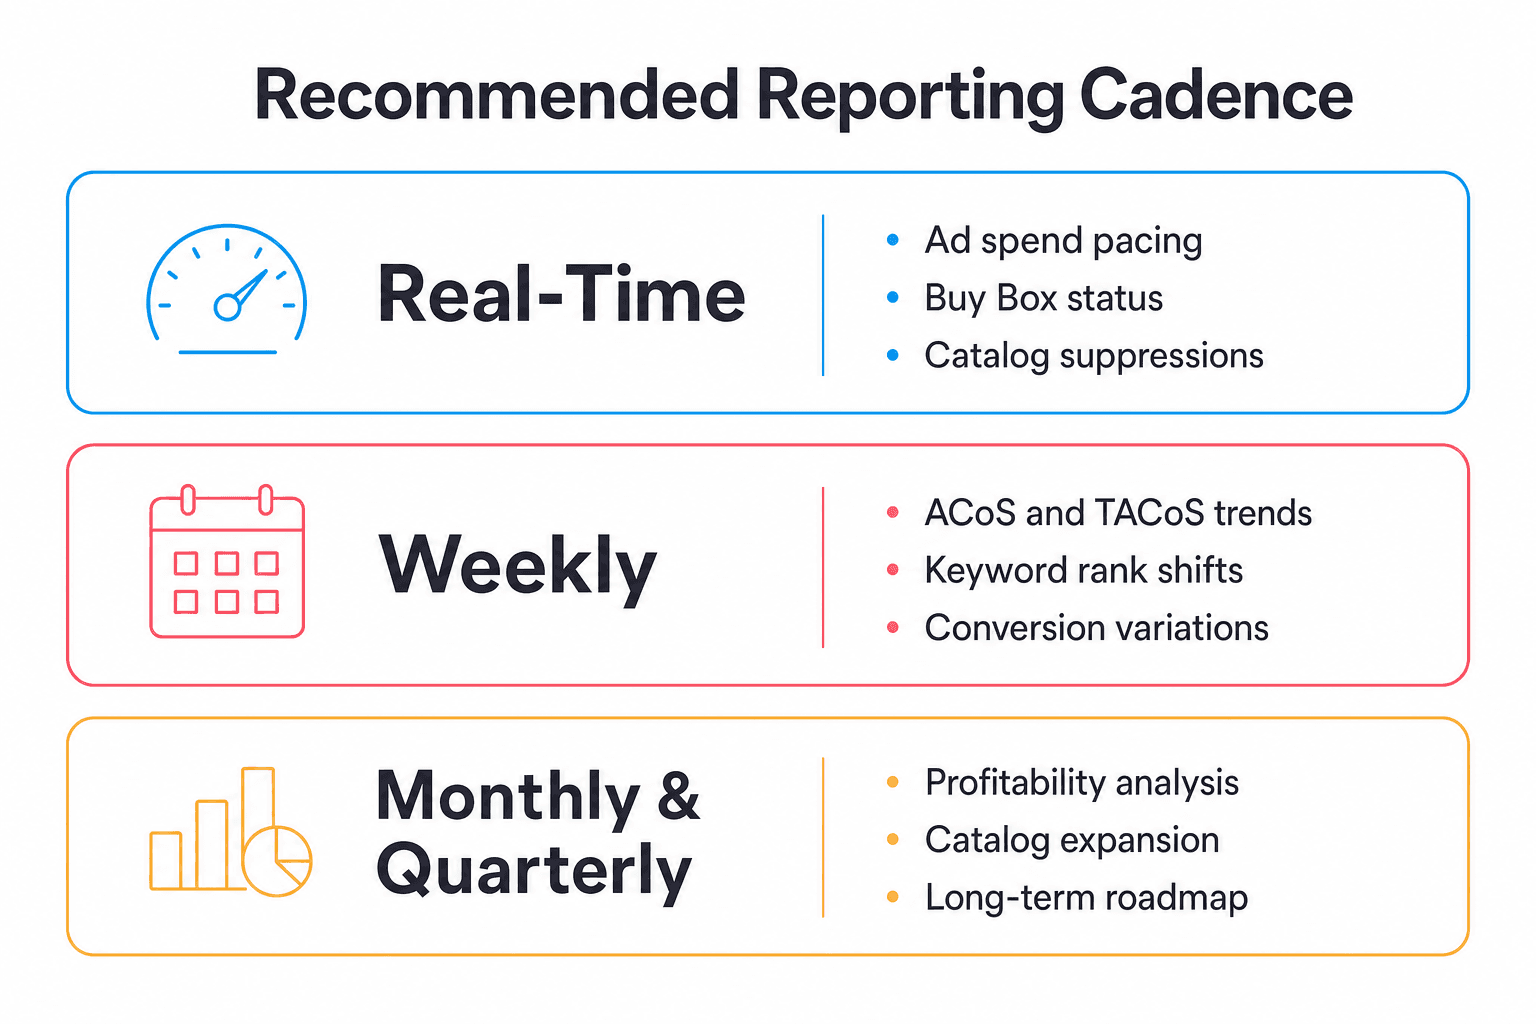
Real-Time Streamed Analytics
Critical operational signals - such as Buy Box loss, budget depletion, or listing suppression - require immediate attention. Waiting for a weekly email to discover that a top-selling listing was suppressed for 48 hours results in direct revenue loss. Modern agencies provide live dashboard access that streams operational data continuously.
Weekly Operational Reviews
Weekly reports focus on short-term performance trends and tactical adjustments:
Evaluating campaign-level ACoS and TACoS adjustments.
Reviewing keyword harvesting and negative target implementations.
Assessing weekly conversion rate changes from listing A/B tests.
Monitoring inventory burn rates against inbound shipment schedules.
Monthly and Quarterly Strategic Alignment Meetings
Monthly and quarterly reviews transition from tactical execution to high-level business strategy:
Net Margin and Profitability Analysis: Evaluating true profitability after agency fees, Amazon FBA fees, ad spend, and COGS.
Competitor Share of Voice Analysis: Evaluating category positioning against top niche competitors.
Product Launch Roadmaps: Planning new product variations, seasonal promotions, and creative refreshes.
Moving Beyond the "Weekly Spreadsheet Trap"
Traditional agency reporting often relies on manual spreadsheet exports. Account managers spend hours copying data from Seller Central into static spreadsheets, converting raw data into manual reports.
As highlighted in the agentcentral guide on Amazon seller KPI data workflows, manual reporting creates significant operational vulnerabilities:
Data Lag: By the time a spreadsheet is cleaned and formatted, the underlying data is already several days old.
Context Fragmentation: Ad spend data lives in one tab, inventory levels live in another, and conversion rates sit in a third, making cross-metric analysis difficult.
Execution Delay: Manual reporting focuses on explaining past performance rather than executing real-time optimizations.
To avoid these traps, brands should partner with organizations that treat performance data as an integrated, real-time analytics layer.
The Lumian AI Approach to Real-Time Governance
At Lumian AI, performance reporting is built into the management infrastructure. Rather than relying on manual spreadsheet assembly, Lumian AI's Amazon account management solutions utilize autonomous AI agents that monitor catalog health, advertising efficiency, and inventory velocity around the clock.
Continuous Metric Streaming: Account metrics are updated in real time, allowing brand owners to track ACoS, TACoS, conversion rates, and Buy Box ownership through live analytics interfaces.
Integrated Anomaly Detection: If a product listing loses the Buy Box or ad spend accelerates unexpectedly, automated circuit breakers pause campaigns and notify account managers within minutes.
Human-in-the-Loop Oversight: Experienced e-commerce strategists review performance data alongside AI agents, ensuring tactical adjustments align with long-term brand objectives.
Transparent Audit Trail: Every automated adjustment, bid shift, and keyword harvest is recorded in a timestamped audit log, providing complete transparency into account management actions.
To discover how continuous metric monitoring and hybrid AI governance can transform your brand's Amazon performance, explore Lumian AI's platform capabilities or schedule an account strategy consultation.
Frequently Asked Questions
What is the most important KPI to track when working with an Amazon agency?
While ACoS measures direct ad efficiency, Total Advertising Cost of Sales (TACoS) is the most critical metric for overall brand health. TACoS measures total ad spend relative to total sales, revealing whether advertising is successfully driving organic growth and net profitability.
How often should my Amazon management agency provide performance reports?
Your agency should provide live, real-time dashboard access for continuous metrics like spend and Buy Box status. In addition, expect structured weekly operational updates covering PPC and conversion trends, along with monthly strategic reviews focusing on net profitability and catalog growth.
What is a good target ACoS for an established Amazon brand?
A good target ACoS depends on product gross margins and lifetime customer value. However, industry benchmarks for established products generally range between 20% and 28%, while new product launches often target higher ACoS levels during initial keyword ranking phases.
Why is manual spreadsheet reporting problematic for Amazon accounts?
Manual spreadsheet reporting introduces data lag, human error, and fragmented views across advertising and inventory metrics. By the time static reports are delivered, market conditions may have shifted, missing opportunities for real-time optimization.
How does Lumian AI combine automated reporting with human agency management?
Lumian AI uses specialized autonomous agents to process real-time marketplace data, manage PPC execution, and flag account anomalies continuous. Dedicated human strategists review these insights to refine growth strategies, approve high-stakes changes, and ensure complete accountability.