What Results and Metrics Can Clients Expect from Lumian AI?
Discover the KPIs, case study benchmarks, and 90-day results Lumian AI's autonomous agents deliver, paired with expert human oversight.
TL;DR
What to Expect: A comprehensive breakdown of the core Key Performance Indicators (KPIs), operational benchmarks, and realistic performance trajectories when deploying autonomous AI agents paired with expert human oversight on Amazon and e-commerce platforms.
Key Takeaways:
Advertising Efficiency: Transitioning from manual campaign adjustments to continuous algorithmic optimization targets a 20-35% reduction in Advertising Cost of Sales (ACoS) and improved Total ACoS (TACoS).
Conversion Uplift: Automated listing experiments, visual refreshes, and keyword matching yield a 15-25% increase in conversion rate (CVR).
Inventory Health: Machine learning demand forecasting can reduce stockout events by 25-30%, protecting organic keyword rankings and buy box share.
Human Plus Machine Model: AI agents handle execution velocity and real-time data ingestion, while strategic brand managers ensure governance and goal alignment.
Intro
Scaling an e-commerce brand on Amazon requires managing thousands of moving variables simultaneously. Brand managers frequently face a trade-off between strategic growth planning and day-to-day tactical execution, such as adjusting keyword bids, updating catalog listings, monitoring buy box changes, and calculating reorder points across complex SKU catalogs.
When brand operations shift from fragmented, manual workflows to an AI-native infrastructure, performance measurement must evolve beyond superficial vanity metrics. Evaluating an autonomous platform requires analyzing direct operational outcomes across advertising efficiency, conversion rates, catalog health, and inventory capital efficiency.
Core KPIs for AI-Native E-Commerce Management
Evaluating performance under continuous AI automation requires monitoring four fundamental categories of operational and financial metrics.
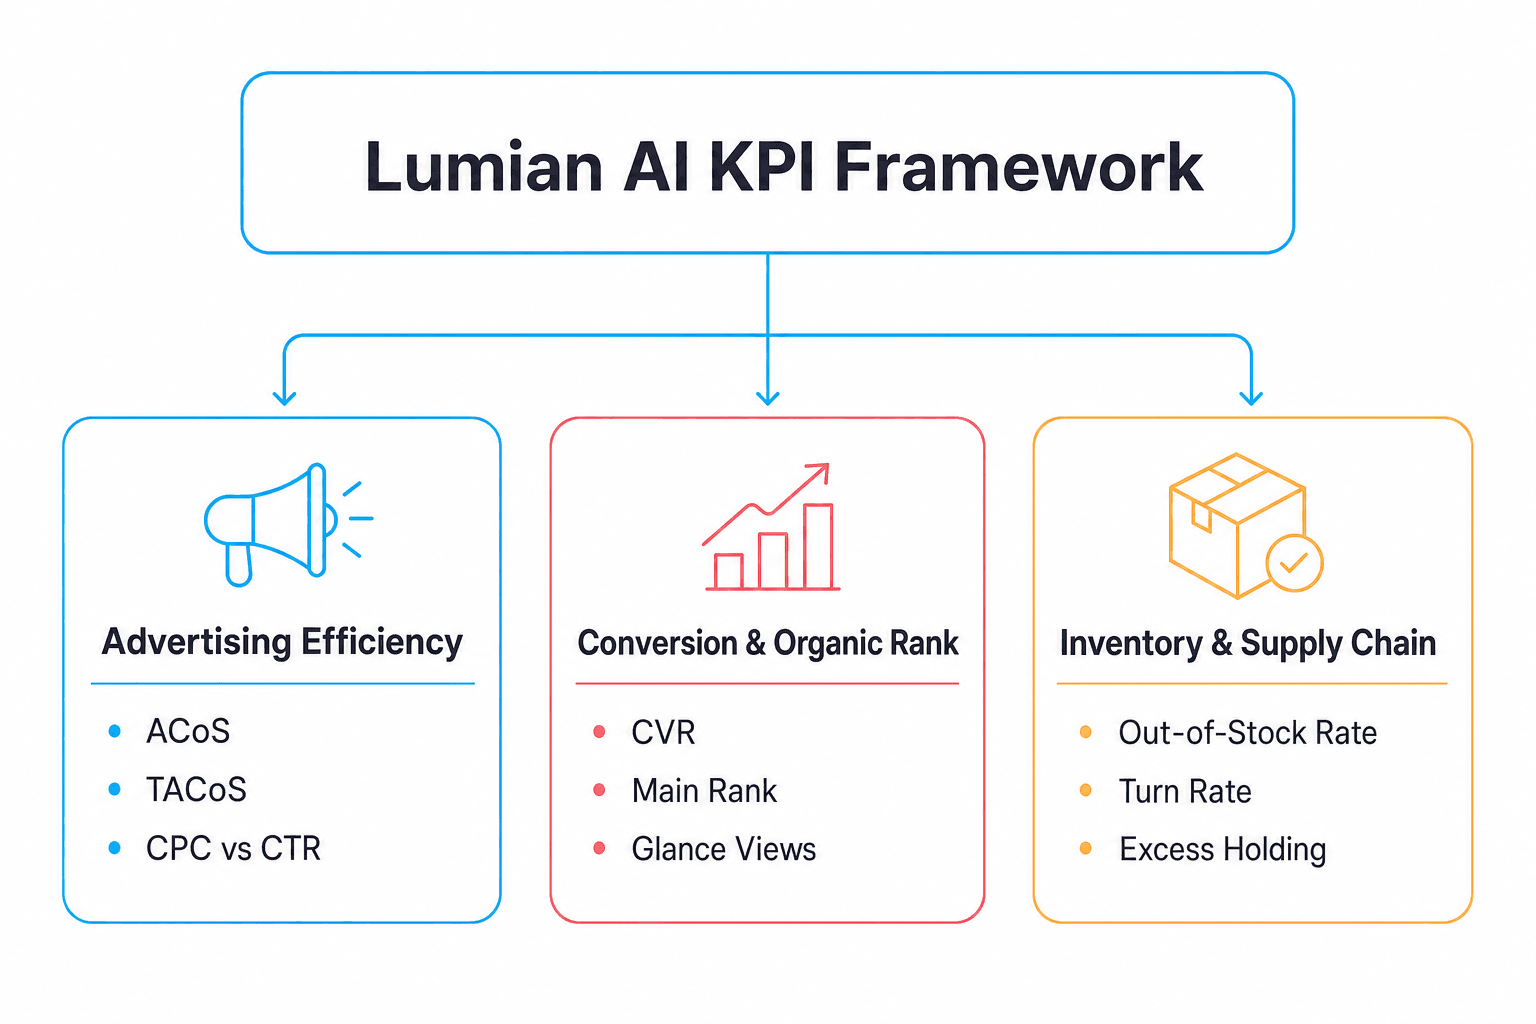
1. Advertising Efficiency Metrics
Managing Amazon Sponsored Products, Sponsored Brands, and Sponsored Display requires continuous bid adjustments based on real-time search velocity and conversion probabilities.
Advertising Cost of Sales (ACoS): Measures direct campaign efficiency by dividing ad spend by ad-attributed revenue. While optimal targets depend on product gross margins, accounts running automated bid management consistently target lower ad spend per sale. Industry data compiled by Sequence Commerce on Amazon Advertising shows that brands adopting machine-learning campaign automation typically see a 20-35% reduction in ACoS within 60 to 90 days of deployment.
Total Advertising Cost of Sales (TACoS): Measures ad spend relative to total revenue (organic plus paid). TACoS reflects overall brand health. As AI agents harvest high-intent search terms and convert ad traffic into organic keyword ranking gains, TACoS decreases even if top-line ad budgets expand.
Cost Per Click (CPC) and Click-Through Rate (CTR): Predictive bidding models dynamically adjust keyword bids by time of day, device type, and placement yield, reducing wasted spend on low-converting clicks.
2. Conversion and Listing Health Metrics
Traffic acquisition yields minimal return if product detail pages are unoptimized or out of compliance with platform style guides.
Unit Session Percentage (Conversion Rate - CVR): Automated A/B testing of title structures, main image assets, and bullet points directly drives conversion improvements.
Organic Share of Voice (SoV): Tracking organic search positioning across primary seed keywords verifies whether paid advertising is successfully driving organic discoverability.
Listing Accuracy and Suppression Rates: Autonomous agents monitor catalog changes continuously to detect suppression, unauthorized buy box loss, or category misalignment before sales volume suffers.
3. Inventory and Operations Metrics
Advertising and listing optimization depend on continuous product availability. Running out of stock degrades organic keyword rankings and wastes historical ad equity.
Stockout Rate: Research from McKinsey & Company on AI in supply chain management indicates predictive demand planning can reduce inventory and safety stock levels by 20-30%, with stockout-driven lost sales dropping by as much as 65% in some deployments.
Inventory Turnover Rate: Machine learning models integrate historical velocity, promotional calendars, and supplier lead times to optimize safety stock levels, preventing capital tie-up in dead stock.
Performance Benchmarks: What the Data Shows
To establish realistic goals, brands must evaluate performance against validated market benchmarks rather than ungrounded projections.
Performance Metric | Traditional Manual / Agency Average | AI Agent + Human Partner Benchmark | Primary Driver |
Campaign Optimization Frequency | Weekly or bi-weekly manual adjustments | Continuous 24/7 real-time bid tuning | Algorithmic API execution |
Listing Conversion Uplift | Static listing updates; periodic testing | +15% to +25% average CVR increase | Automated creative & text optimization |
Average ACoS Reduction | Dependent on manual ad manager capacity | 20% to 35% improvement in 60-90 days | Predictive bidding and negative harvesting |
Stockout Prevention | Reactive reordering based on past sales | 20% to 30% reduction in stockout days | Predictive lead time and demand modeling |
Operational Time Saved | 20-30 hours/week spent on reporting | 50%+ reduction in routine manual tasks | Autonomous reporting & monitoring |
The fundamental value of deploying specialized AI agents via Lumian AI's Amazon management solutions lies in execution velocity. While human teams can manage a limited number of keyword bid changes per day, autonomous agents evaluate bid performance across entire catalog variations every hour.
Case Study Scenarios: Quantifiable Impact in Practice
Examining typical implementation patterns based on an actual Lumian Agent client engagement illustrates how combining automated agents with human oversight addresses common e-commerce scaling challenges.
Scenario A: Multi-SKU Consumer Packaged Goods (CPG) Brand
Challenge: A growing CPG brand with 120 SKUs experienced rising Cost Per Click (CPC) across competitive search terms, leading to an unsustainable ACoS of 42% and squeezed profit margins.
Execution: Specialized AI agents were connected via Amazon's API to analyze search term reports continuously, harvest negative keywords, and adjust bids based on conversion probability. Simultaneously, automated image and content modules tested updated product listings.
Results: Within 60 days, campaign ACoS stabilized at 27%, while CVR rose from 9.2% to 12.8%. Total revenue grew 34% driven by improved organic keyword positions on top-tier terms.
Scenario B: High-Growth Home & Kitchen Retailer
Challenge: Rapid seasonal demand shifts created frequent stockouts on core hero SKUs, followed by over-purchasing that inflated warehouse holding costs.
Execution: Predictive inventory models integrated lead time variances, ad campaign promotional schedules, and historical seasonal trends to adjust reorder alerts dynamically.
Results: Out-of-stock instances decreased by 28% over two quarters, preserving organic search rank during peak promotional periods and reducing excess holding costs by 18%.
For an in-depth breakdown of tailored implementation strategies, explore Lumian AI's case study library to review detailed performance metrics across diverse product categories.
The 90-Day Implementation and Metric Growth Timeline
Results from AI-driven account management accrue systematically across predictable deployment phases:
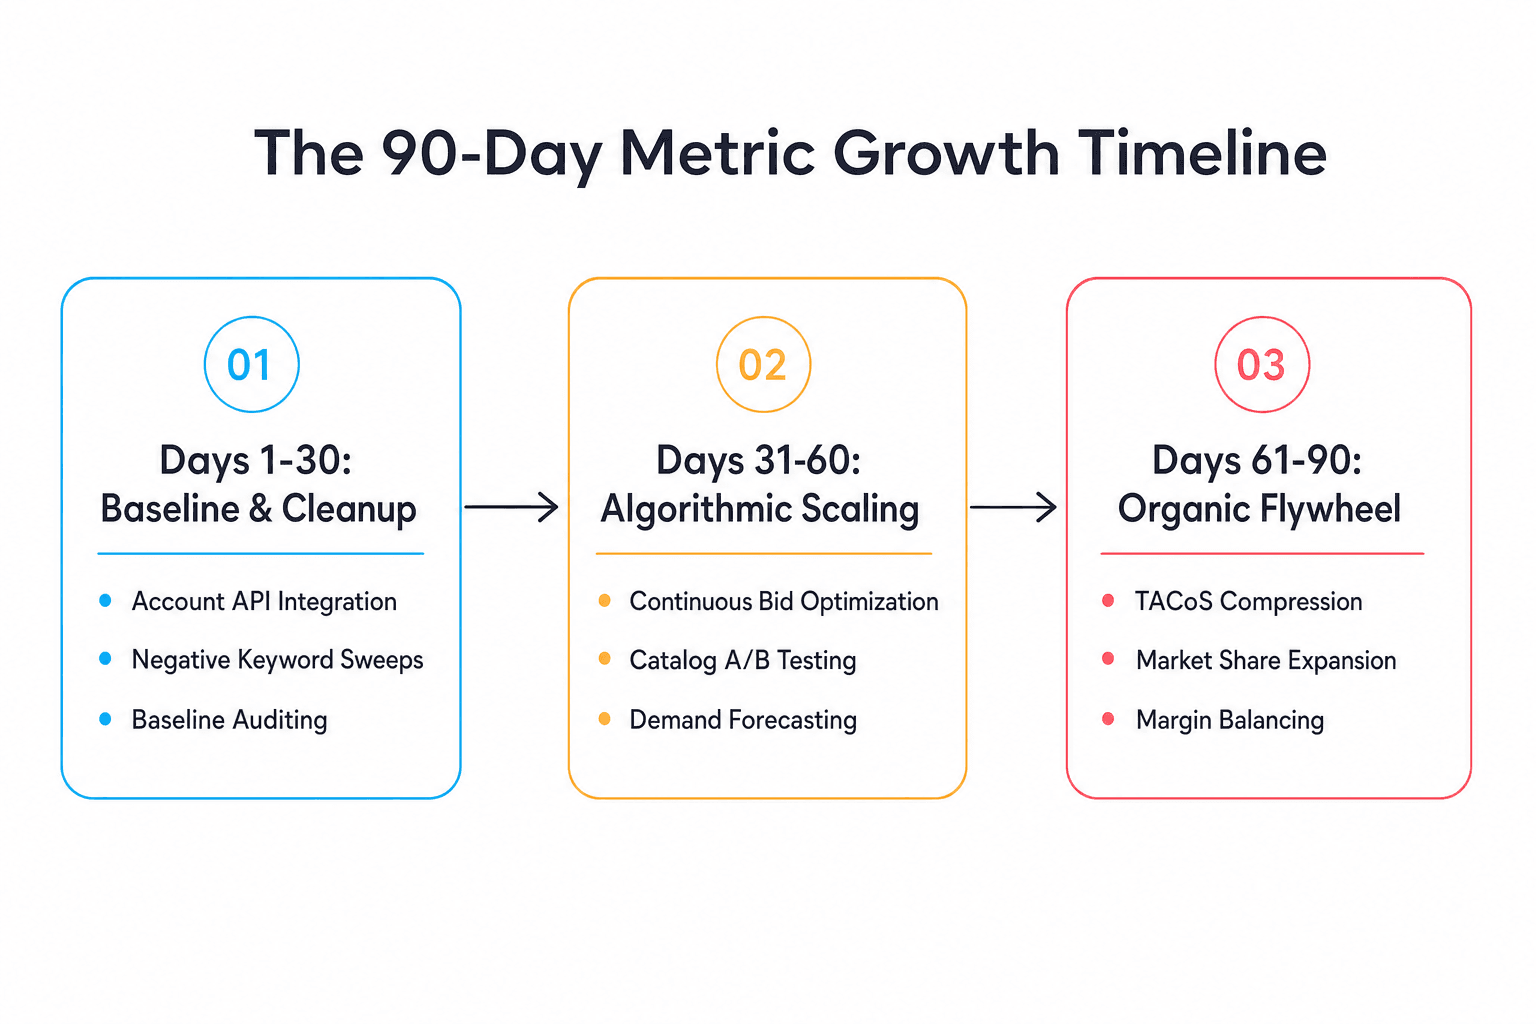
Days 1 to 30: Audit, Baseline, and Initial Efficiency Gains
Establishing baseline metrics across ad spend, TACoS, conversion rates, and inventory velocity.
Automated sweeps identify wasted ad spend, budget leaks, non-converting search terms, and catalog suppression issues.
Initial bid adjustments eliminate inefficient high-cost keywords.
Days 31 to 60: Active Optimization and Conversion Testing
AI agents run real-time bid adjustments, optimizing campaigns across placement types and time-of-day traffic patterns.
Automated listing experiments go live, testing headlines, bullet structures, and visual assets to raise baseline CVR.
Machine learning inventory models begin forecasting reorder thresholds based on actual sales momentum.
Days 61 to 90: Organic Rank Building and TACoS Compression
Increased CVR and improved ad conversion rates signal product relevance to search algorithms, driving organic rank gains.
Revenue shifts toward organic search, compressing TACoS and expanding net profit margins.
Strategic human brand managers utilize AI insights to refine long-term expansion plans, new product launches, and promotional calendars.
To evaluate how these timelines apply to your specific product catalog, review Lumian AI's platform features and service offerings or schedule an account audit with a brand strategist.
Frequently Asked Questions
What are the primary KPIs used to measure AI agent performance on Amazon?
The primary KPIs include Advertising Cost of Sales (ACoS), Total Advertising Cost of Sales (TACoS), Unit Session Percentage (Conversion Rate), Stockout Rate, and Organic Share of Voice (SoV) for target keywords.
How quickly can a client expect to see measurable changes in advertising ACoS?
Initial ad spend efficiency gains typically occur within 14 to 30 days as automated sweeps eliminate wasted spend. Full ACoS stabilization usually takes 60 to 90 days.
Why is TACoS a better measure of overall success than ACoS alone?
ACoS measures advertising performance in isolation, while TACoS measures total ad spend against total sales (ad-attributed plus organic). A declining TACoS shows advertising is building organic rank and driving overall profitability.
How do AI agents prevent product stockouts?
AI agents analyze real-time sales velocity, ongoing ad campaign acceleration, historical seasonality, and supplier lead times to dynamically calculate reorder points and alert operators before inventory drops below critical thresholds.
What is the role of the human brand manager when AI agents run the account?
AI agents handle high-velocity data processing, real-time bid execution, catalog monitoring, and automated reporting, while human brand managers provide strategic direction, approve major positioning shifts, and govern capital allocation and automated actions.

Co-Founder & CEO, Lumian
Robin Lobo is Co-Founder and CEO of Lumian. He built and sold a seven-figure eyeglasses brand on Amazon and spent several years on the client side of traditional agencies before founding Lumian, an AI-native Amazon agency backed by $3M led by Bowery Capital.